Whoops! We're lost too!
The page you're looking for is gone.
CONTACT US TODAY!
1777 South Harrison Suite 1200
Denver, CO 80210
Phone: 720-524-3664
DIVORCE SUPPORT RECENT POSTS

Inside the Numbers: Statistical Insights on Divorce Timing
University of Washington Associate sociology professor Julie Brines and doctoral candidate Brian Serafini analyzed the numbers of people that filed for divorce in Washington state from 2001 to 2015. What they found is that March had the highest number of filings and December the lowest.
This makes sense because most people don't want to file during the holiday season. Then after the holidays have passed and they realize that they don't want to spend another holiday like the most recent then start filing.
In the most commonly cited article it shows a chart that looks like the top of Batman's head, two very large peaks in March and August are the top of his ears.

News articles and statistics often reference this article because it is the only study that has been conducted that actually puts some numbers on the rate of divorce on a monthly basis.
Unfortunately this chart is terrible.
It makes it look like there is a massive change in March and a huge drop off after August. Nothing could be farther from the truth.
I love statistics and math and I want to be honest in what we do. So I did some digging.
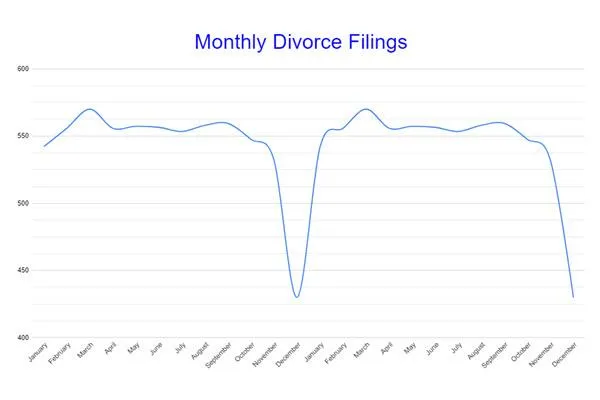
In another article Julie Brines mentions some actual numbers: March had 570 divorce filings, August had 558, and December had 430.
This is what I needed to analyze the numbers. I recreated the chart and mapped a new chart on top of the chart above in order to get as close to the "ln" numbers shown. Then I was able to turn the "ln" numbers into actual numbers using the 3 numbers above as a reference.
From this I was able to translate the numbers and put them into 2 years of data to see how they actually compare month to month.

A Better View of How Many people file each month
This graph shows that, indeed there is a fairly large drop off in filings from November to December (19%) and then the number of people filing rebounds just above previous levels. The rate continues to rise slightly until March and then it tapers back to the average levels. And yes, there is a small bump in August again until the numbers start to drop off, SLIGHTLY until December hits again.
How does this affect you?
If you are considering divorce and need help you will find that lawyers know that January through March is when they will have more people looking for help. Rates may go up, availability goes down.
The courts will have more people filing which could mean more delays.
Nevertheless, the differences aren't as massive as you might think. So, if you are ready to file OR if you are not wanting a divorce now you have better perspective on what others are doing.
Learn more about how to manage the difficult emotions at Rebuilders.net
© 2025 After Divorce Support | All Rights Reserved
